New method for measuring noise figure of multi-channel RF receiver
In the process of multi-channel receiver reception, the addition of noise limits the signal-to-noise ratio and sensitivity of the signal. Because the signal received by the RF receiver is weak, its noise characteristics are particularly important. On the other hand, in the process of multi-channel imaging, the receiving paths of different channels may be different. Even if the receiving paths are the same, the noise characteristics of each channel may not be exactly the same. Therefore, accurate measurement of the noise figure of each level of each channel of the receiver is very important. The traditional noise figure measurement method cannot meet the requirement of measuring large noise figure. And in the actual multi-channel measurement, it is necessary to make the measured channel in the receiving state, and other channels do not work to reduce the noise interference between the channels to ensure the accuracy of the measurement. Considering the weakness of the received RF signal, the front end of the RF receiver usually has a pre-amplification stage implemented with a low-noise amplifier. Based on the characteristics of the receiver, this paper proposes a multi-channel MRI RF receiver as an example To switch the method of measuring noise figure, design an eight-choice radio frequency switch to make the noise figure test switch in different channels, and control the on-off of the DC power supply of the front low noise amplifier to make it in the amplified and non-amplified state. In the amplified state, the noise is amplified to provide a source of thermal noise, and vice versa a source of cold noise. This amplifier switch measurement method optimizes the Y-factor measurement noise figure method, making the measurement more accurate and easy to perform.
1 The principle of optimizing the measurement noise figure
The noise of the RF receiver mainly includes the thermal noise of the resistor and the shot noise of the PN junction, which are all in the category of white noise. White noise does not include any discrete components, and its level conforms to a Gaussian distribution. The power spectrum is evenly distributed in a certain frequency range. Noise figure is an important parameter that characterizes the noise characteristics of a linear two-port network or two-port converter system. Its standard definition is: the ratio of the signal-to-noise power ratio at the input of the receiver to the signal-to-noise power ratio at the output. According to Nyquist theorem, the utility noise generated at the input of the standard noise temperature T0 (290 K) is the power kT0 B; k is the Boltzmann constant (1.38 × 10⁻²³J / K); B is equal to Effective bandwidth. Suppose the net noise gain of the network is G. For a linear network, the net noise gain is equal to the power gain of the net signal. Then the output net power generated by the input terminal is GkT0B, and the port input and output signals and noise The powers are Psi, Pni, Pso, and Pno, respectively, and two mutually equivalent definitions of noise figure (F) can be obtained:
Since the receiver under test does not work in the linear region, and the signal source method needs to know the equivalent noise bandwidth of the network under test, it is very difficult to accurately determine the equivalent noise bandwidth, so the test error of the signal source method is relatively large, and the actual test The noise source method is required. Commonly used methods of measuring noise figure using the noise source method include: gain method, Y coefficient method and noise figure instrument method. Using a noise figure tester is the most direct method of measuring noise figure. It is also the most accurate in most cases. And the noise figure can be measured in a specific frequency range. The analyzer can display the gain and noise figure at the same time to help the measurement. But when the noise figure exceeds 10 dB, the measurement result is very inaccurate. For the MRI radio frequency receiver, the range of the noise figure that this method can measure is too small, obviously not applicable. Both the gain method and the Y-coefficient method are measured using a spectrum analyzer. The difference is that the gain method requires prior knowledge of the gain of the component under test and is limited by the noise floor of the spectrum analyzer. The Y coefficient method is a typical method for measuring noise figure. In the measurement, when the input end of the network under test is at 2 different available powers (for example: the hot state T and the cold state T of the noise generator), the output end can get 2 corresponding available powers PNO, PNO , The ratio of these two powers is usually recorded as Y, and the equivalent noise temperature of this two-port network (or two-port components) is Te, the gain is G, and the noise coefficient of the measured network is F. Get:
Measuring the noise figure with the Y factor requires a cold noise source and a thermal noise source to achieve different noise power inputs at the input, usually by applying voltage to the solid-state noise source and without voltage, that is, when a DC voltage is applied to the noise generator The noise generator generates a noise output to form a thermal noise source. When no voltage is applied, the residual noise generated by the thermal disturbance inside the noise generator forms a cold noise source. The method of applying voltage is only suitable for measuring a small noise figure. When the noise figure of the network under test is large, a high Y factor is required to reduce the measurement error. Therefore, a higher DC power source is required to obtain the thermal noise source. This is difficult to achieve in practice, that is, the traditional Y factor measurement method has a large error, so it is necessary to optimize the noise source. Since the second stage of the receiver is a front low-noise amplifier, its noise figure is very small compared to other stages of the receiver, and it can be directly measured with a noise figure meter. The gain of the low-noise amplifier used in the receiver is 30 dB, so the amplifier can be controlled so that it provides a thermal noise source for the next stage when it is working, and a cold noise source without amplification, so that you can get The larger Y factor reduces the error when measuring large noise figures. And no additional noise source and DC power supply are needed, simplifying the design.
2 Realization of multi-channel switching (RF SWITCH)
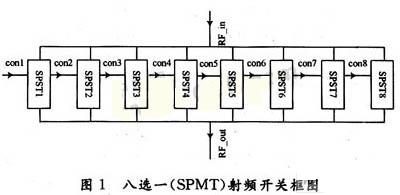
The receiver used in the experiment has 8 channels, and the actual measurement of noise figure requires each channel to be measured separately with a spectrometer, that is, only one channel of the eight channels works, and the other 7 channels are in the open state, and in the RF receiver The channel input without receiving signal needs to be covered with a 50 Ω resistor. According to the above analysis needs to design an 8-channel RF switch to choose any channel, and the output of the other channels that are not working presents a 50 Ω impedance.
This feature can be designed using PIN switches. The PIN switch is a radio frequency semiconductor control device made by using the electrical characteristics of the PIN diode under different bias. It has excellent switching characteristics: when the PIN diode is forward DC biased, the RF signal is approximately short-circuited; when the PIN diode is reverse biased, the RF signal is approximately open circuited. PIN diode switch has the characteristics of fast control speed, small loss and large power capacity.
As shown in Figure 1, a single-pole single-throw RF switch is placed on each channel, and each switch has a control line to control its on and off. The switch of any one of the eight choices can be achieved by setting the only one of the eight control lines to select the conduction.
Measure the frequency range, insertion loss and isolation of the RF switch with a vector network instrument R & S ZVB4. The results are shown in Figure 2:
Figure 2 shows the characteristics of the RF switch designed in this paper at a center frequency of 63.6 MHz and a bandwidth of 120 MHz. Figure 2 shows the S21 curve when the switch is on. The upper curve in FIG. 2 is S21 when the switch is off, and the lower curve is S22 when it is off (reflecting the reflection characteristics of the output end). It can be seen from the figure that the insertion loss of the switch in the on state is only -0.259 dB; in the isolated state, the transmission loss near the center frequency is -32.205 dB, and the reflection coefficient at the output is -34.568 dB. It shows that the switch has good turn-on and cut-off characteristics in the wideband range with the receiver's operating frequency as the center frequency, and the output end is well matched in the cut-off state. Because the receiver only works in the narrow-band range around the center frequency, the design specifications of the switch meet the requirements and the performance is superior to the design specifications.
3 receiver noise test structure and specific methods
The carrier frequency of the signal received by the receiver is a narrow-band signal of 63.6 MHz, so it is only necessary to measure the noise characteristics with a center frequency of 63.6 MHz and a narrow bandwidth. The noise test needs to measure the noise figure of each stage, and the noise figure and gain of each stage of the receiver are different. In order to measure the accuracy, different measurement methods must be used.
Because the noise figure of the low noise amplifier is small, it can be directly measured with a noise figure meter. In the experiment, the N8973A noise meter produced by Agilent was used for measurement. Since the low-noise DC power supply used by the receiver was at the output end, and the input end of the noise figure meter could not be directly connected to DC, the output of the amplifier should be isolated during measurement Connect the straight capacitor into the noise meter.
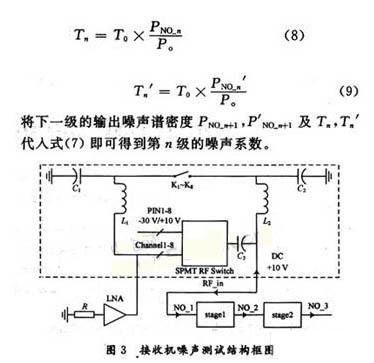
For the network with a larger noise figure in the receiver, the measurement method of optimizing the Y factor mentioned above needs to be used. Due to the structure of the receiver itself and the need for the amplifier to work in two states of amplification / non-amplification in this method, the measurement is in progress. Need to design the control circuit to meet the measurement requirements. As shown in Figure 3, the channel switching and preamplifier control circuit designed for the experiment in the dotted box, the receiver model outside the box, and the input terminal of the amplifier use 50 Ω to replace the receiving coil to provide noise input. At the same time, in order to simplify the block diagram, only draw The receiver's amplifier has 2 stages. In the MRI RF receiver, the voltage (DC + 10 V, as shown in Figure 3) for the low-noise amplifier is drawn from the RF core of the system, that is, the signal line. In the test design, place a DC switch on each path (K1 ~ K8) Control the power supply voltage of the amplifier. C3 is a DC blocking capacitor, and L1 and L2 play a role in blocking the RF signal and turning on the DC. When a certain DC switch K is closed, a 10 V DC voltage passes through L2 and L1 to the amplifier output to supply power to the amplifier. In the state of noise amplification. When K is disconnected, the amplifier has no power supply voltage, and no noise amplification effect can be achieved. Controlling the on and off of the DC switch K can provide a source of cold and hot noise for each stage of the receiver test.
In the test, set the control lines of each switch to make the one to be tested conductive, and the other to open, close the DC switch of the channel, and then use the spectrometer to measure the output noise spectral density PNO_n, and then open the channel DC switch, and then use a spectrometer to measure the output noise spectral density PNO_n, due to the noise spectral density P at room temperature T0 (290 K). It is about -174 dBm, and the equivalent temperature of the noise source is Tn, Tn, we can get:
The spectrum analyzer used in the experiment is F4411B of Agilent, the center frequency of the test is 63.6 MHz, and SPAN is 20 MHz. Select "Noise" in "FuncTIon", set the appropriate VBW / RBW, adjust the RefLevel so that the spectrum analyzer is on the noise floor, when the Ref Level is -63 dBm, the noise floor is reached, and after "Average" it is displayed as -153.1 dBm. Control each CON line so that the channel switches 8 more channels, and repeat the above measurement steps to get the noise figure of each channel.
4 Conclusion
Using this method, the noise figure of each level of each channel switching of MRI RF receiver was tested. The measured channels are within 0.2 dB of the index value defined in the design, and because the receiving part of the high-frequency communication system has certain The commonality, that is, the noise figure of the entire receiver is usually considered, the first stage of the receiver must be connected to the front low noise amplifier. Therefore, this method can be extended to other RF receivers.
This article addresses the comparison of the noise figure of multiple channels of the RF receiver and the measurement of the noise figure of different modules of the receiver. Originally, the low-noise amplifier at the front end of the receiver was used to provide a method for measuring the Y-factor measurement of hot and cold noise sources, and an MRI RF receiver was used as an example to design a multi-channel RF switch with excellent performance to achieve channel switching. Practice has proved that this method is applicable and Effective.
What is a wall GFCI socket?
A wall GFCI socket is different from conventional sockets. In the event of a ground fault, a wall GFCI socket will trip and quickly stop the flow of electricity to prevent serious injury.
Wall GFCI socket protect You From Electric Shock Due To:
1.With safe lock protection function,wall GFCI socket safety is improved.when miswired,wall GFCI sockets have no power and can not be reset,so it is more safe than conventional socket.
2.The wall GFCI socket includes end-of -life monitoring function,it can not reset correctly when the wall GFCI socket reaches the end of life.
3.Improved resistance to surge and corrosion.
4.Easier installation.(installation instructions enclosed)
Generator GFCI UL,Industrial Generator GFCI UL,Generator GFCI UL for Generator,No Load Generator GFCI UL
Hoojet Electric Appliance Co.,Ltd , https://www.hoojetgfci.com